-
In 2022, Uber achieved a remarkable revenue of $31.8 billion, marking an impressive 82% growth compared to the previous year.
-
The ride-hailing segment accounted for $14 billion in revenue, while the mobility sector contributed $10.9 billion.
-
The remaining revenue was generated from their freight services.
-
Uber experienced an 11% year-on-year increase, with a total of 131 million individuals utilizing Uber or Uber Eats at least once a month.
-
In terms of trips, Uber drivers completed a staggering 7.6 billion rides in 2022, surpassing their previous peak of 6.9 billion trips recorded in 2019.
Real projects. Real ROI — 2,000+ deliveries driving business impact across 50+ Countries. Explore Now
Real projects. Real ROI — 2,000+ deliveries driving business impact across 50+ Countries. Explore Now
Lets talk AI
Dev Technosys
Ship smarter products with AI that fits
your roadmap.
Get a quote
Explore AI solutions
AI services & solutions
View AI hub- Generative AI Development
- Predictive Analytics Services
- Natural Language Processing Services
- Chatbot Development
- AI Voice Assistant Development
- Machine Learning Development
- Chatgpt Integration Services
- Neural Network Development
- AI Copilot Development Services
- AI Consulting Services
- Deep Learning Development Company
- Agentic AI Development Company
- AI Development Services in Canada
Recommended AI reads
View category- How AI Copilots Are Transforming Mobile Apps in 2026
- 10 Signs Your Business Needs Machine Learning Solutions Right Now
- How To Develop A Multilingual Chatbot For Website?
- 8 Steps to Build an AI App in 2026
- How To Develop Uncensored AI Mobile Apps?
- Agentic AI in Healthcare: From Automation to Intelligent Decision-Making
- How to Make Money with AI in 2026–2027: 25 Profitable Business Ideas
- Cost to Hire AI Developers in 2026: An Ultimate Guide
- How to Secure Business with AI in 2026: Strategies, Tools & Best Practices
- Role of AI in SaaS Development
- How to Start an AI Business in 2026–2027: Complete Entrepreneur's Guide
- Autonomous AI Agents in Blockchain: Use Cases, Risks, and the Road Ahead in 2026
- 10 Questions to Ask Before Hiring an AI Consulting Firm
- How to Develop an LLM Agent: A Step-by-Step LLM Development Guide for Businesses
- How to Develop an AI Chatbot App Like Ask AI?
- All insights & thought leadership

Uber Revenue and Usage Statistics
Buckle up and prepare to delve into the thrilling world of Uber, where technology and transportation seamlessly merge! In this blog, we embark on a data-driven expedition to uncover the jaw-dropping revenue and usage statistics that shape the ridesharing giant's journey.
Hold tight as we navigate through the sprawling urban landscape, where millions of riders and drivers connect every day. Witness how Uber's innovative platform revolutionized the way we commute, transforming the streets into a digital ecosystem of convenience and efficiency.
From mind-boggling revenue figures that paint a portrait of remarkable growth to captivating usage insights that shed light on the preferences of modern travelers, we'll unveil the intricate details of Uber's triumphs and challenges. Get ready to be awed by the power of data as we decode the extraordinary success story behind this tech-driven transportation revolution. Welcome aboard!
Uber Key Statistics
Uber Overview
| Launch date | May 2010 |
| HQ | San Francisco, California |
| People | Dara Khosrowshahi (CEO), Travis Kalanick (co-founder), Garrett Camp (co-founder) |
| Business Type | Public (NYSE: UBER) |
| Industry | Ride hailing |
Uber Revenue
In 2022, Uber achieved a revenue of $31.8 billion, experiencing an impressive 82% increase compared to the previous year. However, in 2020, Uber faced a 21% decline in revenues as a result of the coronavirus pandemic.
Uber Annual Revenue 2014 to 2022 ($bn)
| Year | Revenue ($bn) |
|---|---|
| 2014 | 0.4 |
| 2015 | 1.7 |
| 2016 | 5 |
| 2017 | 7.9 |
| 2018 | 11.3 |
| 2019 | 14.1 |
| 2020 | 11.1 |
| 2021 | 17.4 |
| 2022 | 31.8 |
Uber Revenue By Segment
After enduring significant setbacks from lockdowns in 2020 and 2021, Uber's mobility segment emerged as the primary revenue generator in 2022.
Uber Annual Revenue By Segment 2018 to 2021 ($bn)
| Year | Mobility | Delivery | Freight | Other |
|---|---|---|---|---|
| 2018 | 8.9 | 0.7 | 0.3 | 0.1 |
| 2019 | 10.4 | 1.3 | 0.7 | 1.3 |
| 2020 | 7.9 | 4.8 | 0.9 | 1.3 |
| 2021 | 7.5 | 8.3 | 2.1 | 0.4 |
| 2022 | 14 | 10.9 | 6.9 | - |
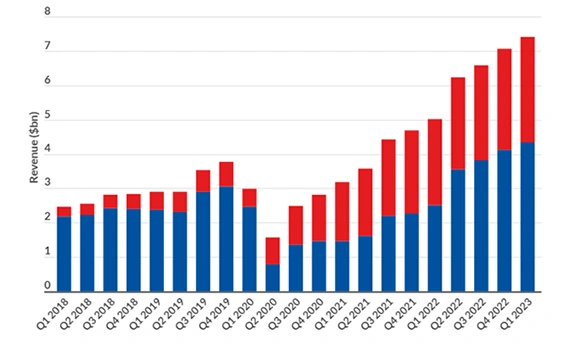
Uber Mobility And Delivery Revenue
In 2022, all three of Uber's primary segments experienced increased revenues. Remarkably, freight revenues saw the highest growth rate, reaching a significant 228%, surpassing the growth rates of both the mobility and delivery segments.
Uber Mobility And Delivery Segment Revenue 2018 to 2022 ($bn)
Uber Revenue By Region
Despite expanding its operations globally, the majority of Uber's revenue in 2022, amounting to $19.4 billion, was still generated from the United States and Canada. This indicates that these two countries continue to play a significant role in contributing to Uber's overall revenue.
Uber Annual Revenue By Segment 2018 to 2022 ($bn)
| Year | US & Canada | LATAM | EMEA | APAC |
|---|---|---|---|---|
| 2018 | 6.4 | 1.9 | 1.7 | 1 |
| 2019 | 8.5 | 1.9 | 2.2 | 1.2 |
| 2020 | 6.8 | 1.3 | 1.8 | 1.5 |
| 2021 | 10 | 1.4 | 3.2 | 2.7 |
| 2022 | 19.4 | 1.9 | 6.9 | 3.4 |
Uber Profit
Except for 2018, Uber has faced challenges in achieving profitability. In 2022, the company encountered a significant hurdle with a negative impact of -$7 billion resulting from the revaluations of its investments. This factor further contributed to the financial difficulties experienced by Uber in attaining profitability.
Uber Annual Profit / Loss 2014 to 2022 ($bn)
| Year | Profit/Loss ($bn) |
|---|---|
| 2014 | -0.7 |
| 2015 | -1.6 |
| 2016 | -3.6 |
| 2017 | -4 |
| 2018 | 1 |
| 2019 | -8.5 |
| 2020 | -6.7 |
| 2021 | -0.4 |
| 2022 | -9.1 |
Uber Gross Bookings
In 2022, Uber achieved an impressive gross bookings figure of $115 billion, marking a notable 27% increase compared to the previous year. This growth in gross bookings reflects the continued expansion and success of Uber's services during that period.
Uber Annual Gross Bookings 2016 to 2022 ($bn)
| Year | Gross bookings ($bn) |
|---|---|
| 2016 | 19 |
| 2017 | 45 |
| 2018 | 50 |
| 2019 | 65 |
| 2020 | 57 |
| 2021 | 90 |
| 2022 | 115 |
Uber Users
In 2022, the number of people using Uber reached 131 million, representing an 11% increase compared to the previous year. Among those users, approximately 85 million individuals utilized Uber Eats, highlighting the popularity and widespread adoption of Uber's food delivery service.
Uber Annual Users 2015 to 2022 (mm)
| Year | Users (Mm) |
|---|---|
| 2015 | 11 |
| 2016 | 37 |
| 2017 | 68 |
| 2018 | 91 |
| 2019 | 111 |
| 2020 | 93 |
| 2021 | 118 |
| 2022 | 131 |
Uber Trips
In 2022, Uber drivers accomplished an impressive total of 7.6 billion trips, marking a significant 20.6% increase compared to the previous year. This milestone represents the highest number of trips completed in a single year, surpassing the total trips recorded in 2019. The substantial growth in trips highlights the continued demand and utilization of Uber's services by customers worldwide.
Uber Annual Trips 2017 to 2022 (bn)
| Year | Trips (bn) |
|---|---|
| 2017 | 3.79 |
| 2018 | 5.21 |
| 2019 | 6.9 |
| 2020 | 4.98 |
| 2021 | 6.36 |
| 2022 | 7.64 |
Uber FAQ
-
What is Uber's revenue?
Uber's revenue varies, but in 2020, it reported a revenue of $11.14 billion.
-
How many rides does Uber complete daily?
On average, Uber completes millions of rides every day globally.
-
What is the market share of Uber?
Uber holds a significant market share in the ride-sharing industry, estimated to be around 70% globally.
-
What percentage of orders on Postmates are food orders?
According to a report by Second Measure, food orders accounted for about 80% of Postmates' total orders in 2019.
-
How many active users does Uber have?
As of 2021, Uber had over 93 million monthly active users worldwide.
-
What is the growth rate of Uber's revenue?
Uber's revenue has experienced fluctuations over the years, but it has shown steady growth since its inception. However, specific growth rates may vary year to year.