




















A demand forecasting pilot can assure sharper choices, more streamlined inventories, and fewer surprises, but first comes the question: Is one’s data up to speed?
The best forecasting models can still fail if the data that powers them is not complete, inconsistent, or too old, to mention just a few possibilities. Before launching a pilot, organizations must think not just about the volume of the data, but also about its quality, history, level of detail, and relevance to the business.
In a way, demand forecasting data readiness can serve as a solid ground for the forecasting pilot: even an excellent model can still fail if the foundations of its database are not solid.
In checking for these conditions ahead of time, the company can pinpoint gaps in advance and thus establish reasonable expectations, giving its pilot a much better chance for success.
What is Demand Forecasting Data Readiness?
Demand forecasting data readiness refers to the series of activities that make sure the data is accurate, complete, consistent, and appropriate for demand forecasting.
This process analyzes a number of elements such as historical sales, inventory data, prices, promotions, seasonality, product information, and external factors before a forecasting pilot is launched.
Good demand forecasting data readiness allows identifying any gaps and issues with unreliable information, aligning different data sources, and defining certain input data for predictive models.
Industry Insights: “According to McKinsey, around 65% of APS programs fail to achieve expected ROI; poor data management remains one of the major contributing factors.”
What Data Does a Demand Forecasting Pilot Need?
More than just historical sales data is needed for a pilot study for demand forecasting data readiness. Data needs to be organized to show the things that customers purchased, when they purchased it, the places where the demand occurred, and the factors that affected buying decisions. Therefore, before commencing a pilot, businesses should check the following data types:
Data Category |
What to Check |
Why It Matters |
| Historical demand | Orders, sales, units sold | Establishes demand patterns |
| Product data | SKU, category, lifecycle | Enables product-level forecasting |
| Location data | Store, warehouse, region | Supports location-level forecasts |
| Time data | Date, week, month, season | Identifies temporal patterns |
| Inventory | Stock levels, stockouts | Separates demand from availability |
| Pricing | Price changes, discounts | Explains demand variation |
| Promotions | Campaigns, offers, events | Captures demand spikes |
| Returns/cancellations | Quantity and timing | Prevents distorted demand signals |
| External factors | Weather, holidays, market events | Adds contextual signals |
10 Data Readiness Checks Before Starting a Pilot
Before implementing demand forecast testing, businesses should ensure that their data is accurate, consistent, accessible, and relevant to the goal of forecasting.
These readiness checks help identify any missing information in old records of items, product details, inventory signals, cost, promotions, etc., before it disturbs the performance of the model and the results of the testing.
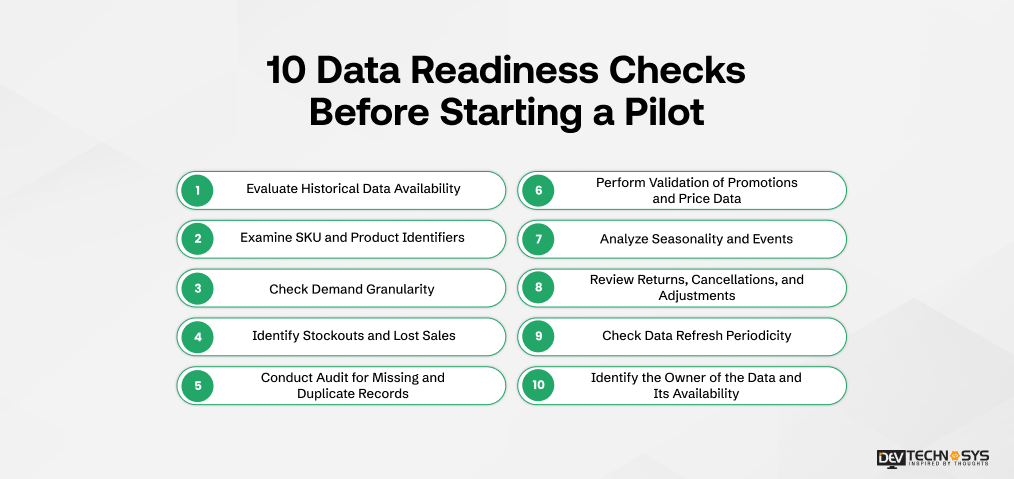
1. Evaluate Historical Data Availability
First, evaluate the historical periods available for analysis. Determine if the database has continuous daily, weekly, and monthly records and look for missing periods, unexpected gaps, or discrepancies caused by migration-related issues with the ERP or POS systems. Good historical coverage enables predictive analytics services to separate genuine trends from faulty data or system errors.
2. Examine SKU and Product Identifiers
Second, check to see if every product has a unique code unifying it across history. Ensure that you do not have duplicate SKUs, products with new names, discontinued items, or items whose hierarchy has changed. Inconsistent identifiers will lead to fragmentation of demand information across many records.
3. Check Demand Granularity
Figure out if the demand information is available by SKU, category, store, region, or any other required format. Check for daily, weekly, or monthly records as well.
Highly aggregated information can obscure small fluctuations in demand, trends at the level of certain goods, and short-term trends which are important to forecasts.
4. Identify Stockouts and Lost Sales
Sales records may not always reflect what customers really want. In case there are no products available, the sales register might show zero sales although customers definitely wanted the products.
Supply chain management software development solutions identify periods of stockouts, check for available stock, and identify lost sales signals to prevent forecasting systems from interpreting a lack of supply as low demand.
5. Conduct Audit for Missing and Duplicate Records
Identify missing records, duplicate transactions, invalid timestamps, negative amounts, abnormal sales amounts, and same order IDs in the dataset. These problems may create false spikes of demand or hide real trends. It is important to set up validation rules before the pilot to be able to identify problems with records while conducting the analysis.
6. Perform Validation of Promotions and Price Data
If it is possible, book the period of time with past sales data in connection with discounts, promotions, coupons, and price changes. An increase in sales may be caused by the fact that some promotion was launched instead of an increase in demand as a result of normal conditions.
7. Analyze Seasonality and Events
Determine any recurrent and additional activities that have an impact on demand, such as holidays, feasts, weather phenomena, pay periods, periods when schools have classes, and events adhering to specific industries.
Those factors can explain seasonal demand fluctuations that cannot be explained solely by sales records. Write down event dates and match them with the corresponding location and items.
Market Insights: “As per the PwC, 87% of operations leaders say poor data quality has affected digital initiatives, highlighting data readiness as a critical foundation for AI.”
8. Review Returns, Cancellations and Adjustments
The return, cancellation, refund, and inventory adjustment activities can distort previous demand estimation by mixing them with sales transactions. Assess how each action is recorded and decide if numbers should be separated, amended, or treated as independent signals. Managing activities consistently will result in a more precise representation of the real buying behavior.
9. Check Data Refresh Periodicity
Find out how often forecasting data is updated (real-time, daily, weekly, bandwidth). This depends on the business usage, the forecasting process phases, how quickly the product moves, and how fast the data should be acted on.
For example, fast-moving consumer goods tend to require more frequent updates compared to products that undergo longer purchasing processes and are planned for monthly or quarterly procurements.
10. Identify the Owner of the Data and Its Availability
Determine the places where forecasting data is stored (ERP, POS, WMS, CRM, etc.). Identify who the owner of each data source is and how often it is updated. The more accurate the ownership is and the more accessible the data is, the shorter the window period it would create during a forecasting pilot.
Free App Idea Reality Check: Let's Stress-Test Your Concept
Share your app idea with us. Within 3 business days, we'll uncover UX gaps, feature opportunities, and potential development challenges, so you can build with confidence. No strings attached.
How to Measure Demand Forecasting Data Quality?
To effectively measure the quality of AI demand forecasting data readiness, businesses must do more than merely check whether data points exist. This process requires verification of the data set’s completeness, validity, consistency, accuracy, uniqueness, and timeliness. This assessment aims to identify issues such as missing data, transactional errors, and redundant data.
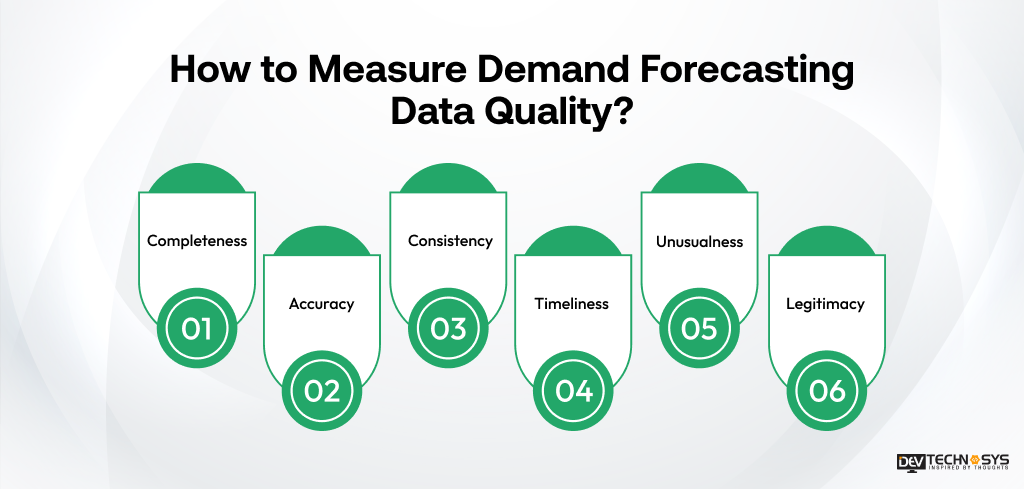
1. Completeness
Check if all necessary records are available in relation to products, locations, dates, transactions, inventory, pricing, promotion, etc. Missing dates or fields can lead to inconsistently filled information, which results in forecasting input becoming less reliable.
2. Accuracy
AI data engineering RAG services make sure recorded data corresponds to the actual business transactions and operations. Wrong data in terms of quantities, prices, dates, etc. can lead to hidden trends.
3. Consistency
Check whether SKU numbers, location names, date formats, units of measure, and categories comply with certain requirements across the systems.
4. Timeliness
Check whether information is received in due time for carrying out forecasts or whether this information is already old. Timely information can really help in forecasting when demand changes fast or if the inventory needs to be updated regularly.
5. Unusualness
Identify duplicate transaction or order numbers, product records, and other duplicated data points. Duplicate data can inflate demand and provide wrong signals to forecasting systems.
6. Legitimacy
Check that values adhere to the required business rules, which include correct dates, positive amounts, valid products (SKUs), and fair pricing. Invalid records should be flagged before entering the forecasting process.
How to Prepare Data for a Demand Forecasting Pilot?
A well-organized preparation process is necessary to convert unprocessed operational information into dependable forecasting inputs. The entire process should follow Source – Clean – Standardize – Enrich – Validate – Split – Pilot, to make sure no dataset is improvable before the process of inventory management software development.
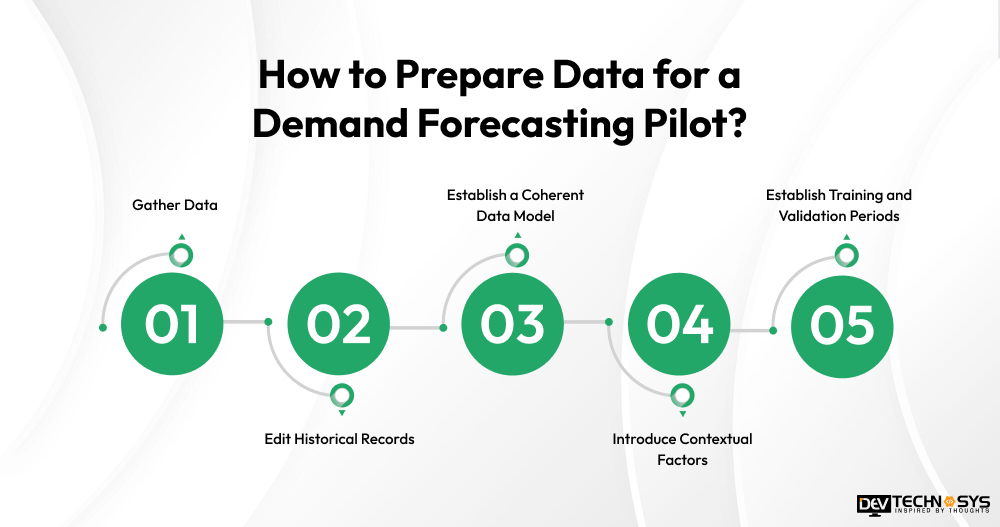
Step 1: Gather Data
Join required data sources in a controlled environment. Merge sales, inventory, product, price, promotional, and location data from various sources such as ERP, POS, WMS, e-commerce platforms, or warehouse management software development solutions. Ensure the data sets are linked so that transactions can be associated with the respective products, locations, and time frames.
Step 2: Edit Historical Records
Analyze the historical records for missing values, duplicated records, erroneous timestamps, wrong quantities, or any peculiar values. Create rules for how to address each issue rather than deleting records automatically.
Step 3: Establish a Coherent Data Model
Unify SKU numbers, locations, date information, and categories across all related datasets so that they remain consistent in their naming conventions, measurement units, date formats, and product hierarchy.
A common data model minimizes integration mistakes and helps ensure the inputs used in forecasting are indeed comparable across different products, locations, systems, and periods.
Step 4: Introduce Contextual Factors
Supplement the historical demand with confounding factors that can explain the variations in consumer behavior. Your choice of contextual factors can include promotional and pricing campaigns, holidays, out-of-stock situations, and weather, among other things.
Contextual factors can help differentiate between regular demand and temporary shifts in demand due to product availability, seasonal events, or external factors.
Step5: Establish Training and Validation Periods
It is crucial to distinguish between training and validation time periods from historical data based on time and not mix records randomly. The model must use information from earlier periods to learn and be evaluated later on unseen data. Evaluating on data seen during training can lead to artificially positive results and cover up issues in forecasting methods.
How Do You Know Your Data Is Ready for a Demand Forecasting Pilot?
Your data is prepared for a pilot of demand forecasting software when it is comprehensive, precise, coherent, punctual, and available in order to generate useful insights across the necessary products, locations, and time spans.
Historical demand data should be sufficiently representative, and stockouts, promotions, price changes, returns, and seasonal events should be traceable. Product and location names should remain constant in all systems.
Additionally, it is critical to define a training and validation period with clear descriptions of the relevant data each time before modeling starts, as well as set rules regarding data ownership, frequency of renewals, and access criteria.

Conclusion
A successful pilot of demand forecasting data readiness emphasizes using robust information prior to choosing the model. At first, consider the possibility of data availability, data quality, and the business environment, then design the pilot by picking the forecasting model.
The proposed sequence enables companies to identify gaps as early as possible and choose the strategy for future AI forecasting. If you are interested in AI demand forecasting solutions, supply chain analytics, customized sales forecasting software, or AI data readiness assessment, feel free to consult an AI development services provider.
Frequently Asked Questions
Find answers to the most common questions related to this article.
Generally, demand forecasting readiness uses some information from historical sales, product type, its place of sale, stocks, pricing, promotions, returns, and calendar data. In certain cases, weather, holidays, market circumstances, and some other external factors can be used for improvement of forecast data.
The necessity of using historical information depends on demand patterns, forecast horizon, seasonality, and business cycles. Generally, pilot actions shall include enough historical periods to make it possible to identify repeating trends, seasonality, promotions, and rare cases of demand.
Data suitability is determined by its completeness, accuracy, consistency, timeliness, uniqueness, and reliability. Suitable data needs to contain trustworthy demand history, stable product and location identifiers, pertinent business context, and a proper level of granularity.
Stockouts can lead to a difference between actual customer demand and sales recorded by the company because the products were not available. When stockout periods are not recognized, demand forecast